
Our process
Onboarding in minutes. Results within 60 days.
A clear, four-step path from sign-up to higher revenue — backed by real client outcomes.

Getting Started
Getting started is easy in 4 simple steps
Choose your services
Pick the tier that fits how involved you want to be. Sign our simple agreement — no long-term lock-in.
Onboarding meeting
Complete our 15-minute Onboarding Assessment so we can sync calendars, connect listings, and prep your strategic launch plan.
Strategic marketing plan
Before you go live, we set milestone targets for the first 60 days and the first year — built around your goals.
Earn more
Host your first guests, watch performance dashboards, and let our team continuously optimize your listings for maximum revenue.
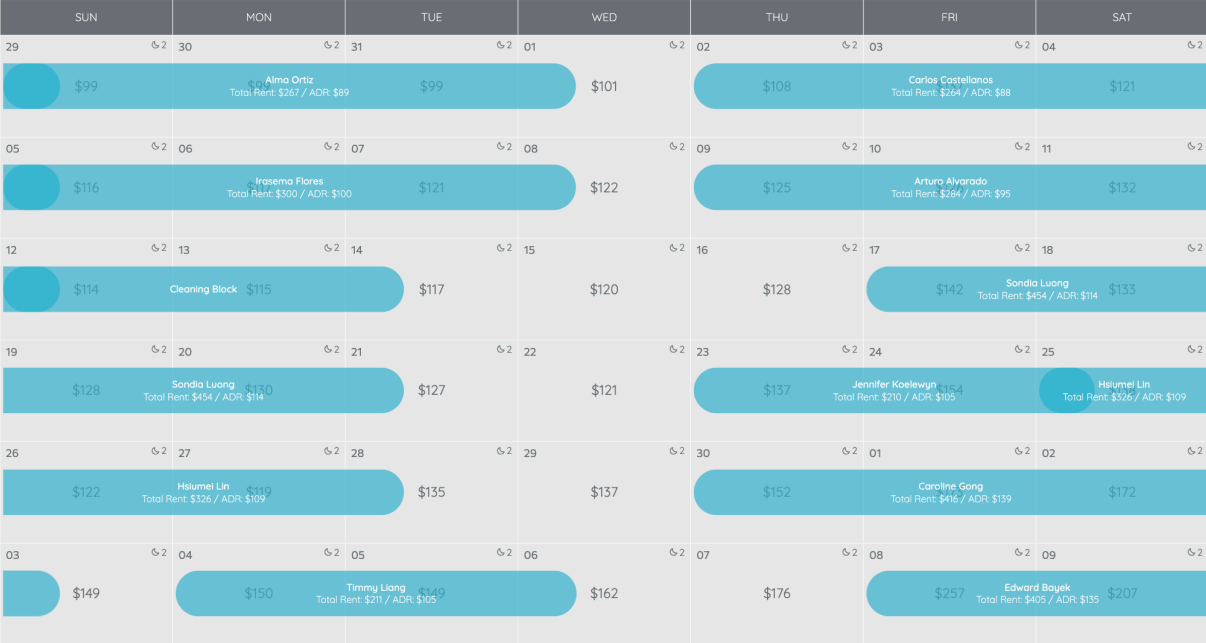
Case studies
Average producers, turned market leaders.
Real portfolios. Real numbers. Verified year-over-year revenue gains.
Case Study: Denver Vacation Rental Management Company
A Denver-based vacation rental company with 25 listings was struggling with low revenue and inconsistent pricing. By implementing a data-driven dynamic pricing strategy, optimizing listings, and improving booking performance, significant growth was achieved. As a result, revenue increased by 50% in June and 83% in July 2025, with one property outperforming the market by 400%.
"In July 2025, Jackson almost doubled our revenue without adding extra work for our team."
+50%
June revenue boost
+83%
July revenue boost
400%
Flagship vs market index
Case Study: Yosemite Listing April 2025 vs April 2026
We boosted revenue significantly — April 2024: $2,702 → April 2025: $3,955
Before

After
Case Studies: March 2025 vs March 2026
New clients past performance last year compared to current performance this year working with us.
1. Yosemite property management company:
$9k more
in accommodation fare
8% more
occupancy
$7 more
ADR

2. Joshua Tree portfolio:
$23kmore
in accommodation fare
15% more
occupancy
$21 more
ADR
